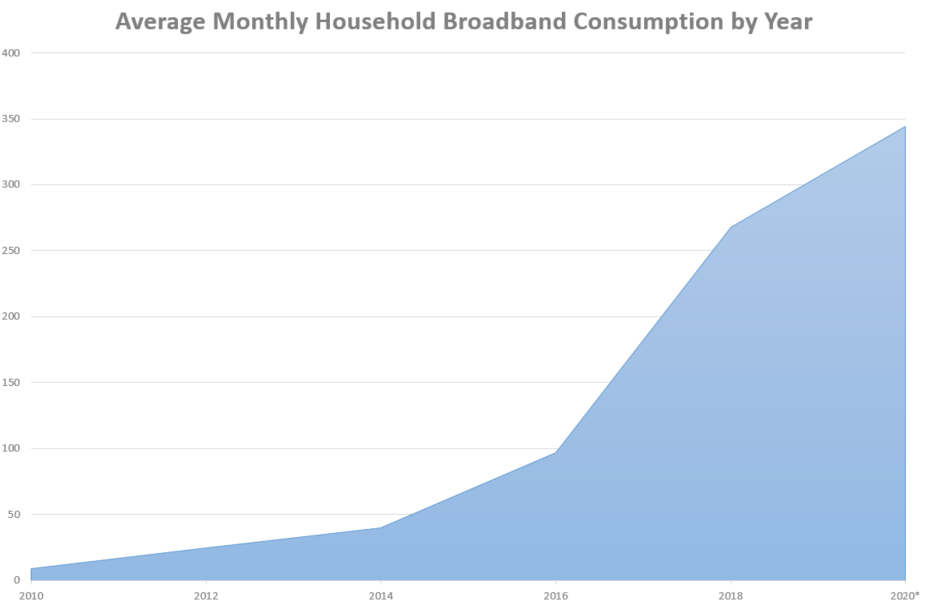
- The average household is using 3.5x the amount of internet data they were five years ago.
- The average household is using 38x the amount of internet data they were ten years ago.
- If this trend continues, we estimate the average internet customer will hit ISP data caps and pay associated overage fees by 2023.
There’s no doubt the average consumer is using more bandwidth than ever before. With services like Netflix and YouTube offering millions of HD video, or every household having a half-dozen devices constantly using data over home connections, it should surprise no one that the amount of content downloaded or streamed in a given month is rapidly growing.
We wanted to see what this trend has looked like over the past decade, so we pulled historical data from the FCC’s annual reports. We found that not only is average household broadband data usage growing, it is doing so at such a rapid clip that in a matter of years the average household usage total is likely to exceed 1 TB of data per month.
This number is important because as it stands right now, most major ISPs have data caps set at 1 TB, where, if exceeded, consumers would be on the hook for overage feeds that can drastically increase a monthly cable bill. One terabyte of data seemed like an impossibly large number even in recent memory, but the reality is many consumers will continue to trend toward it faster than they realize.

The above chart displays the annual increases in average household broadband data consumption over the past ten years. 2020 is estimated based on rolling monthly averages.
| Year | Average Monthly Household Broadband Consumption |
|---|---|
| 2010 | 9 GB |
| 2012 | 25 GB |
| 2014 | 40 GB |
| 2016 | 97 GB |
| 2018 | 268 GB |
| 2020 | 344 GB |
| 2022 | 513.8 GB |
| 2023 | 587 GB |
One interesting thing of note was in the FCC’s reporting of average broadband data usage by year. Each report showed that they increased the ceiling for tracking total data consumption to reflect these overall consumption increases. As an example, they considered usage above 120 GB an outlier in 2010 and didn’t consider those users, raising that number to 160 GB in 2012 and higher again in 2014, etc.
Following right along with the above graph displaying data usage increases are the graphs for metrics like Netflix and YouTube usage. Over the last five years as internet connections have gotten faster and streaming video has gained popularity as entertainment, there is a clear correlation between subscription video on demand (SVOD) and bandwidth usage.
If this trend continues, we believe that the average household will surpass 1 TB of monthly data usage by 2023. Unless ISPs increase their monthly data caps, which they have done as recently as 2016, many consumers might end up faced with increased costs associated with their home internet usage.
Sources:
- FCC annual broadband performance report [1, 2, 3, 4, 5]
- OVBI 2020 report on estimated broadband usage [1]
*Originally published April 15th, 2020
Allconnect: Let us compare providers for you
Why should you choose Allconnect? We’re the #1 broadband marketplace in the U.S, meaning you can trust us to search, compare and order internet and TV service for your home.
Get started
-
Featured
![Internet data caps: Who has them, who doesn’t and what you need to know in 2023]() Internet data caps: Who has them, who doesn’t and what you need to know in 2023 Joe Supan — 6 min read
Internet data caps: Who has them, who doesn’t and what you need to know in 2023 Joe Supan — 6 min read -
Featured
![Could 4K streaming video and gaming quickly eat up your data limits?]() Could 4K streaming video and gaming quickly eat up your data limits? Joe Supan — 4 min read
Could 4K streaming video and gaming quickly eat up your data limits? Joe Supan — 4 min read -
Featured
![Are Americans worried about data caps?]() Are Americans worried about data caps? Allconnect — 2 min read
Are Americans worried about data caps? Allconnect — 2 min read
Latest
-
Monday, April 22, 2024
A guide to website error codesCamryn Smith — 4 min read
-
Friday, April 19, 2024
Can other Wi-Fi networks interfere with mine?Robin Layton — 4 min read
-
Thursday, April 18, 2024
Comcast introduces new pre-paid internet, mobile and streaming plansRobin Layton — 2 min read


